Sports Reference Blog

Archive for the 'Advanced Stats' Category

2024 Preseason WAR Update is Live

19th March 2024

As the 2024 season begins, we have made some updates to our Wins Above Replacement calculations on Baseball Reference. You may notice some small changes to figures as you browse the site. As always, you can find full details on how we calculate WAR here. Read the rest of this entry

Posted in Advanced Stats, Announcement, Baseball-Reference.com, Data, Statgeekery, WAR | 1 Comment »

Stathead FBref: A Football Stats Revolution Has Arrived

29th November 2023

After years of development, we're thrilled to announce that Stathead FBref is here! If you're a Stathead subscriber who loves football (or an American Stathead subscriber who loves soccer), you know just how much of a game changer this is. If you've never heard of Stathead, read on to discover how this is going to change everything for stat-savvy football fans.

Read the rest of this entry

Posted in Advanced Stats, Announcement, FBref, Stathead | Comments Off on Stathead FBref: A Football Stats Revolution Has Arrived

FBref: Progressive Carries back on FBref (and tweak to dribble/take-ons)

3rd February 2023

Last October, when we converted over from StatsBomb to Stats Perform Opta data one of the stats that we had to stop carrying on the site was Progressive Carries. Thanks to help from Michael Caley of the Double Pivot Podcast, we are pleased to reintroduce Progressive Carries to the site. Given our expanded data coverage from Opta, we now have this stat for over 20 competitions (for both current and historical seasons) including most of the top women's football leagues.

Read the rest of this entry

Posted in Advanced Stats, Announcement, Expire30d, FBref | Comments Off on FBref: Progressive Carries back on FBref (and tweak to dribble/take-ons)

Shot-by-Shot xG now on Player Goal Logs

14th November 2022

Thanks to our new data deal with StatsPerform/Opta we are now able to display xG data for individual goals and assists on our player goal logs. Using this information you can now find out things like Lionel Messi had two 0.03 xG goals in the same match vs Alavés on February 13, 2021.

These goal logs are available for all competitions we cover and include xG for the full set of Opta leagues we added last month.

Posted in Advanced Stats, Announcement, FBref, Statgeekery | Comments Off on Shot-by-Shot xG now on Player Goal Logs

FBref: Leagues! 🇵🇹 Leagues! 🇧🇷 Leagues! 🇲🇽 Expanded Women’s and Men’s Data! New Data Partner!

25th October 2022

In our quest to show the most data possible, FBref has taken a major step forward this week. We have dramatically expanded our coverage of leagues and competitions with advanced stats.

In addition to our in-depth data for the Big Five Competitions (England, France, Germany, Italy & Spain), Champions League, Europa League, and MLS, we have added coverage of Women's Football for current seasons (and in some cases historical seasons) for:

  • 🇺🇸 American NWSL
  • 🏆 Women's Champions League
  • 🏴󠁧󠁢󠁥󠁮󠁧󠁿 English Super League
  • 🇦🇺 Australian A-League
  • 🇫🇷 French Division 1 Feminine
  • 🇩🇪 German Frauen-Bundesliga
  • 🇮🇹 Italian Serie A
  • 🇪🇸 Spanish Liga F
  • 🏆 Women's World Cup and Euros

But wait, there's more. On the Men's side we are adding more depth to our coverage including our first in-depth coverage of Latin American Football.

  • 🇳🇱 Dutch Eredivisie
  • 🇵🇹 Portuguese Primeira Liga
  • 🇧🇷 Brazilian Serie A
  • 🇲🇽 Mexican Liga MX
  • 🏴󠁧󠁢󠁥󠁮󠁧󠁿 English Championship
  • 🏆 Conmebol Copa Libertadores
  • 🏆 Men's World Cup, Euros and Copa America

Expanding access to data is a core value at Sports Reference, so we had to make changes to provide this level of coverage. We are pleased to announce that we are now a partner with Stats Perform Opta. Opta's data has replaced the previous data from StatsBomb on our site in all cases. This new partnership is the largest data deal we've ever signed and represents a huge commitment by FBref to advance access to Women's football data throughout the world. We are grateful for the long-term commitment that Stats Perform has made to us. And if you all flock to the site in the way we expect, this is just the start of the data we may present over the life of our partnership with Stats Perform.

Read the rest of this entry

Posted in Advanced Stats, Announcement, expire120d, FBref, Features, Stathead, Uncategorized | Comments Off on FBref: Leagues! 🇵🇹 Leagues! 🇧🇷 Leagues! 🇲🇽 Expanded Women’s and Men’s Data! New Data Partner!

August 2021 Park Factor Update

31st August 2021

Today we released an update to how we calculate one-year park factors for 2020 and three-year park factors that include 2020. In short, we are giving the observed effects of ballparks in 2020 less weight, impacting context-adjusted stats like ERA+, OPS+, Rbat+, and WAR for 2019 through 2021.

There are two reasons for this change. First, the shortened 60-game season decreases the sample of games we have data from, which naturally reduces the significance of the data collected. Second, since teams only played within their own divisions in 2020, comparing scoring in home games vs. scoring in away games does not tell an accurate story of how a park impacted scoring relative to league average, since most of the parks in the league are not included in either set of games (e.g. when computing the park factor for Wrigley Field, games played at Coors Field or Citizens Bank Park are not included in the calculation anywhere, since the Cubs did not play away games at those parks in 2020).

The issue with the way we had been handling 2020 park factors became more apparent as the 2021 season went on, particularly because the Cincinnati Reds’ 2020 park factor of 119 was raising the 2021 three-year park factor, resulting in worse-than-expected adjusted stats for hitters like Joey Votto, and better-than-expected adjusted stats for pitchers like Wade Miley.

Now, when you look at a 2020 team page, the one-year park factors have been diluted so that they include an average of 60 games’ worth of 2020 data, and 51 games each of 2019 and 2021 data. If there is no corresponding 2019 or 2021 data (e.g. new ballpark in Texas, different mix of parks for Toronto), those parts are replaced with a league-average park factor of 100. These new one-year park factors are used in the three-year averages like usual, so the effect is reflected there as well.

With this change, here are some of the most notable movers in Wins Above Replacement:

Zack Wheeler (+0.5) and Aaron Nola (+0.3) each saw a bump up in their 2021 pitching WAR as the 3-year park factor for Philadelphia rose from 96 to 98 (frequent opponent Washington also had their 3-year park factor increase from 93 to 96). Wheeler’s 0.5 is the largest change resulting from this update.

Wade Miley, Tyler Mahle, and Luis Castillo (-0.4 each) saw their 2021 pitching WAR fall. As mentioned above, Cincinnati saw some of the most anomalous park factors in 2020, and mitigating their impact here lowers the expected run environment for these and other Reds pitchers.

On the hitting side, the changes are more modest. Justin Upton and Isiah Kiner-Falefa each saw their 2021 batting WAR rise by 0.3, while Maikel Franco and J.T. Realmuto lost -0.3 from their 2021 WAR.

In 2021, Shohei Ohtani is notably untouched by this update, with changes to his batting WAR and pitching WAR canceling each other out and his 7.9 total WAR remaining the same.

Here is a full list of changes to park factors, rate stats, and Wins Above Replacement from before and after this change.

Posted in Advanced Stats, Announcement, Baseball-Reference.com, Statgeekery, WAR | Comments Off on August 2021 Park Factor Update

WNBA Upgrades on Basketball-Reference

14th April 2021

The WNBA will be entering its 25th season of existence this summer and plans to celebrate the league's storied history. In preparation for this, Basketball-Reference is happy to announce a series of new upgrades to our site's coverage of the WNBA in the past and present.

One of the biggest additions is that we now have play-by-play data for WNBA games back to 2018. This allows for a lot of new features such as:

Quarter and half boxes in box scores
The play-by-play itself, along with a summary of lead changes, scoring droughts and scoring runs
Shot charts for the game, which includes filters by quarter and player
Shooting tables on player pages and league season pages that break down shots attempted and made by distance
Play-by-play tables on player pages and league season pages that detail on/off, turnover types, fouls committed and drawn and more

Other additions include:

A playoffs section: We now have a central playoffs table so you can quickly go through each season's Finals participants as well as postseason top performers in points, rebounds and assists. We also now have playoff summaries for each season that show all the series played in that postseason as well as team playoff stats and postseason individual leaderboards.

Expanded playoff statistics on player pages, including presentation of stats in per-36 minute and per-100 possession formats as well as advanced stats

Improved franchise history pages: Headshots displayed for top-12 in Win Shares in franchise history, additions to season history table such as SRS, pace, and top player in Win Shares. Links added for franchise leaderboards, all players in franchise history, franchise All-Star history, draft history and all-time head-to-head records

Team game logs and team splits pages

Game Highs table on player pages highlighting a player's best single-game performances in each statistic

We're constantly working to improve our coverage of the WNBA and the other leagues we track on Basketball-Reference. If you have any suggestions or feedback, send us your thoughts via our feedback form.

Posted in Advanced Stats, Announcement, Basketball-Reference.com, Data, Features, History, Leaders | Comments Off on WNBA Upgrades on Basketball-Reference

2021 WAR Update

31st March 2021

As we approach the beginning of the 2021 season, we have made some updates to our Wins Above Replacement calculations. You may notice some small changes to figures as you browse the site. As always, you can find full details on how we calculate WAR here.

Defensive Runs Saved Changes

Last week, we updated Defensive Runs Saved (DRS) totals across the site with new figures from Sports Info Solutions that incorporate more accurate hit timing data. This impacts some fielders from 2017 to 2020. You can read more about the updates in the Sports Info Solutions blog, including which teams and fielders were most impacted.

2019 Park Factors

Park factors for 2019 have been re-computed to include the 2020 season, since WAR uses a three-year average for park factors when computing pitching WAR. The most significant change here is the Cincinnati Reds, whose pitching park factor rose from 103 to 108 (where <100 represents a pitcher’s park and >100 represents a hitter’s park). Luis Castillo sees the biggest benefit from this, with his 2019 WAR rising by 0.7 wins. All other changes to pitching WAR from updated park factors are smaller than Castillo’s 0.7 WAR gain in 2018.

2020 Park Factors

When a season is in progress, our three-year average park factors are computed using a prorated combination of the current season and two years prior. Due to the shortened 2020 schedule, the park factors for 2020 were still using some data from 2018, because the 60-game schedule was being treated as a partial in-progress season. We’ve addressed this in our park factor calculations so that the 2020 park factors only include 2019 and 2020. This change was reflected in OPS+, ERA+, Rbat+, and rOBA in the past week, but it is now also incorporated in WAR, leading to small changes for a handful of players.

Lance Lynn gains the most from this, adding 0.3 wins with Globe Life Field moving from a slight hitters park (102) to a more extreme hitters park (107). Trea Turner has the largest change on offense, also gaining 0.3 wins with Nationals Park moving from being a slight hitters park (102) to being a slight pitchers park (98).

New Game Logs from Retrosheet (1901-1903)

Last summer, we updated the site with new data from Retrosheet, including new game logs for players from 1901 to 1903. Having game-level data allows us to be more precise in our WAR calculations, since we can consider the specific ballparks a pitcher played in and the opponents he faced.

We presented a more in-depth example of this in our last WAR update, when Hall-of-Famer Christy Mathewson’s WAR rose after we added new game logs. This time around, pitcher Doc White saw the biggest change, gaining 1.5 WAR over the course of his career.

Biggest Career Movers

The top mover for position players in career WAR is Trea Turner, gaining 1.8 wins through a combination of additional runs saved and beneficial park factor changes. Trevor Story is close behind at 1.7 wins, primarily through additional runs saved.

On the pitching side, we see Doc White with 1.5 wins gained as described above. Among modern players, Patrick Corbin saw his career total drop by 0.8 wins. This is the flipside to how Turner gained credit. Corbin is debited for playing in a more pitcher-friendly park than previously thought, and for playing in front of defenders like Turner who are getting additional credit for their defense. Both of these changes decrease the number of runs we’d expect Corbin to have allowed, and as a result his performance is not as valuable as previously calculated.

We’ve highlighted some of the more extreme changes here, but to see full lists of the largest changes to season and career WAR totals, please see the spreadsheet here.

Thanks to Baseball Info Solutions and Retrosheet for their contributions. Please let us know if you have any comments, questions or concerns.

Posted in Advanced Stats, Announcement, Baseball-Reference.com, Data, Features, History, Statgeekery, Stathead, WAR | Comments Off on 2021 WAR Update

Advanced Stats on Player Pages: How We Made It

26th February 2021

On Tuesday night, we added a new table of Advanced Stats to player pages.

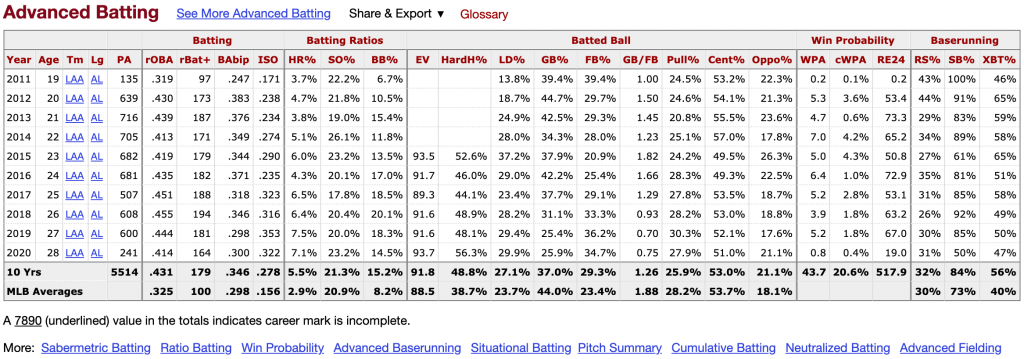
This is what it looks like for hitters:
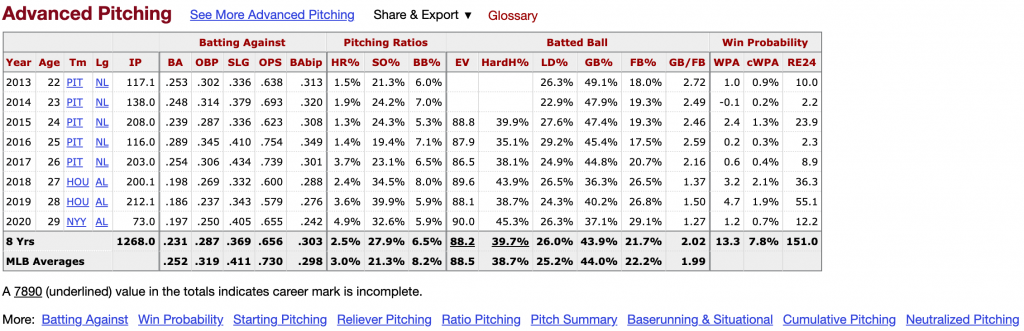
Mike Trout Advanced Stats

And for pitchers:

Gerrit Cole Advanced Stats

Rather than simply explain what we added, I’m going to describe how we added it. How does something go from an idea to a feature on Baseball-Reference? The entire process starts with you, the user.

At the beginning of January, we began conducting interviews with several users to discuss their experience using Baseball Reference and Stathead. By the time we launched the feature, we had spoken with nearly 50 users. It’s important to note that when we started the interview process, we didn’t have a particular solution or even a particular problem in mind.

There were several goals for these interviews. We wanted to find:

  1. What is the general perception of Baseball Reference compared with other sites?
  2. What features would users like us to add to Baseball Reference?
  3. What features would users like us to add to Stathead?
  4. What features of Baseball Reference and Stathead are users having a hard time using, finding, or just remembering to find?
  5. In what ways are people using our sites that we hadn’t anticipated?

Many of the interviews confirmed what we already knew. But every interview had at least one piece of gold that we could learn from. One interview in particular stood out to me and sent me on a path towards designing the feature you see on the site today.

I spoke with Mark Gorosh (@sportz5176 on Twitter) on February 3. Mark was lamenting that we don’t have advanced metrics such as BB% and K% on Baseball-Reference player pages. He didn’t understand why we had so many columns about the inner workings of WAR (in the Player Value table), but not established advanced stats like walk rate.

The issue, of course, is that we do have those stats. At this point I showed Mark the Advanced Batting page and… I’m not going to say Mark yelled at me, but he gave us some tough love that we really needed to hear. He couldn’t understand why all these great stats were not on a player’s main page.

And he was right.

There were a few different paths we could take.

  1. We could take all of the tables on the Advanced Batting pages and put them on the main player page. This wasn’t practical, however. There’s also an Advanced Fielding page and, of course, and Advanced Pitching page for pitchers. Adding all of these for a pitcher would lead to dozens of tables. Having so much on one page would negatively affect user experience.
  2. We could pick and choose certain things to bring over to the main page. Perhaps we could do this in a way that also leads users to click to the Advanced pages.
  3. We could move nothing, but focus on doing a better job of directing users to the player sub-pages (such as advanced batting and pitching, splits, and game logs).

We opted for the second option, but will also be looking to address the third option. The solution for the immediate job at hand is getting some advanced stats on the main player pages. But the fact that Mark (and other users) didn’t even know we had these advanced stats is a symptom of another issue—some users either are not noticing these sub-pages or they know about them but don’t think to use them (because they’re a click away).

This is a big deal because Baseball-Reference has a lot of users, but the super-users are the ones that have discovered the game logs, splits, and other advanced features. From there, they move on to Stathead to get even more powerful tools for their research. We want as many users discovering those features as possible so they can also turn into power users. So, in the future I’ll be looking to improve the player (and team and league) sub-navigation.

Now that we chose the path to explore, there were still different ways to proceed. One was to move the Player Value table (where we show WAR and its components) to the Advanced Batting page, but bring the most important columns (such as WAR, WAA, oWAR, dWAR, etc.) along with the most important columns from other Advanced Batting tables.

We began testing with that.

Francisco Lindor Advanced Stats Mockup

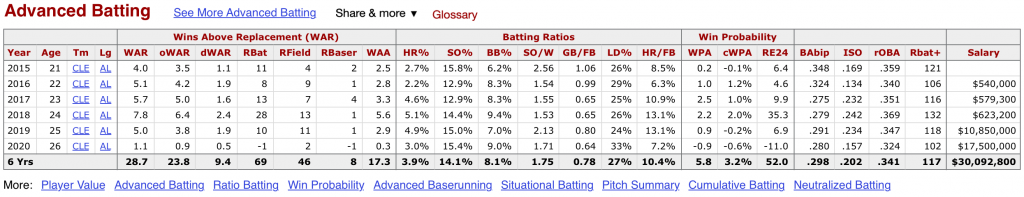
This early mockup tested well but some users showed a very strong preference for keeping the Player Value table where it was and adding a separate Advanced Stats table below it. Honestly, that was probably the right solution all along, but I wanted to see we could solve this without increasing the number of tables on player pages. We ended up adding one, but that’s fine.

There were several key things from this mockup that tested well, such as:

  1. The collection of stats we chose (which were the result of team discussions and also a survey we shared on Twitter).
  2. The addition of rOBA (our version of wOBA—Reference weighted OBA) and Rbat+ (our version of wRC+—based on the Rbat used in WAR). Despite the fact that these stats are brand new, I was impressed by how many guessed right away what they were.
  3. The links under the table to let users quickly jump to any table on the Advanced Batting page from the main player page. Not only does this help raise awareness of the Advanced Batting page, but also lets users know what tables are specifically on the page before they even go there.

The next version we tested kept all of these features, but put them in a separate Advanced Batting table. We also added base-running data, more batted ball data (such as the oft-requested Exit Velocity and Hard Hit %), and a row to display league averages for each stat (because users may not know what a good XBT% is).

That version of the mockup looked much like what you see today:

Francisco Lindor Advanced Stats

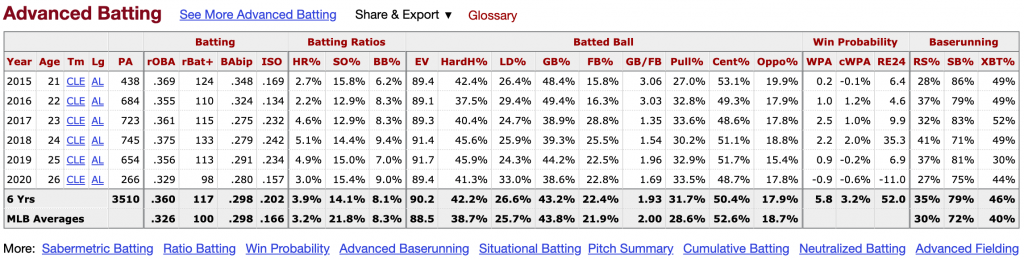
This version tested exceedingly well. Now it came down to building it. I asked Kenny Jackelen (@kennyjackelen on Twitter), Baseball-Reference’s developer, for a summary of the development process for a new feature like this. Kenny said he:

  1. Iterated multiple times with the team internally to get feedback on the table implementation (including how the table should render for players from different eras).
  2. Created new database tables for exit velocity data (which also powers the Hard Hit %)
  3. Added columns to existing tables to store rOBA and Rbat+ more permanently (previously these calculations were done as an intermediate step to get to WAR, so the database structure needed some updates to make it easier to pull them into the page-building process alongside other stats).
  4. Added logic to our play-by-play processing to assign batted balls a Pull/Center/Oppo location so that we can get a count of each type and compute the percentages for the Advanced Batting table
  5. Read a lot of slack messages in ALL CAPS from Adam D—like a marathon runner being handed a cup of water.

When it was ready, I got Mark back on Zoom to see his reaction. He said “it’s a 10.” He elaborated further, saying “It's not enough to be baseball’s best data aggregator. You have to present the information in a way that fans will be able to find it. I was honored that BRef and Adam took my suggestions to heart. The new player page designs put so many great pieces of data in easy to find places… near the top of the page.”

As a researcher, it was very fulfilling to come full circle with Mark. He went from tough love to delight.

As helpful as it was, not all user interviews revolve around tough love. Many users I have spoken with weren’t sure what to expect when they hopped on a call. Far more often than not, it’s just a casual conversation about baseball, the different ways people use the site, and what they’d like to be able to do.

I asked interview subject Jim Passon (@PassonJim on Twitter) if he had any thoughts on the interview process (so you don’t just have to take my word for it). He said “When Adam reached out to me to have a conversation about features that I’d like to see in the future, I couldn’t get the meeting set up quick enough. As expected, the meeting was awesome! I got to make a few suggestions, learn some new tricks, and catch a glimpse of the cool features that were already being developed for the site (which I absolutely loved). I now feel like I’m a part of my favorite site on the web... and that feels pretty good!”

Interviewee Jessica Brand (@JessicaDBrand on Twitter) echoed a similar sentiment, saying “I felt at ease, just discussing sports in depth in every which way with friends. It’s a great way to get those endorphins going to see and meet up with friends at your local stadium/arena/pitch you can’t necessarily see because of social distancing. Interviewing with Adam and Kenny provided the same warm and fuzzies.”

And honestly, in this time of social distancing and quarantine, hopping on the phone to talk about Baseball Reference with some of my favorite writers and analysts has been incredibly fulfilling. If you’d like to chat with me about how you’re using Baseball-Reference and Stathead, feel free to reach out at @baseballtwit on Twitter or go ahead and book a time on my calendar to chat.

Posted in Advanced Stats, Baseball-Reference.com, Data, Features, History, WAR | 2 Comments »

FBref Scouting Reports and Similar Players Launched

10th February 2021

FBref is happy to announce the release of a feature we've been excited about for a while, player Scouting Reports that give you a quick look at how players compare in various statistics to other players at their position. This is currently available for players in the Big Five men's European leagues (example: Mohamed Salah), Major League Soccer (example: Diego Rossi) and the Women's Super League (example: Sam Kerr). We show 20 categories on the main Scouting Report at the top of a player's page, selected based on feedback from user research and industry experts, but you can also click through to a Complete Scouting Report which shows many more categories to compare the players by.

In addition, we have added a Similar Players table which locates the players that have the most similar percentiles in the stats used in the Scouting Reports. That table also offers Compare links which takes you to our Player Comparison tool so you can see the players' statistics side-by-side.

For more information on how the Scouting Report works, we have a longer explainer on FBref. This would not be possible without the wide array of advanced stats provided by Statsbomb, so thanks to them.

Depending on how people react, we could even adapt this feature for our other Sports-Reference sites in the future. Because of that, we are eager to hear people's thoughts on this new feature, so feel free to contact us via our feedback form.

Posted in Advanced Stats, Announcement, FBref, Features, Statgeekery | Comments Off on FBref Scouting Reports and Similar Players Launched